


The Cup and Handle Pattern is a widely recognized and reliable chart pattern that signals a bullish breakout, often used by traders to time their entry into long positions. It derives its name from the way the price action mimics the shape of a teacup, with a “cup” representing the rounded bottom and a “handle” representing a smaller, shallower pullback. This pattern typically suggests that, after a period of consolidation or pullback, the price is ready to resume its upward trend.
The Formation of the Cup
The Cup forms when a stock or asset undergoes a period of decline from a peak, followed by a gradual recovery to roughly the same level as the initial peak. The resulting price action creates a rounded U-shaped pattern, signaling that the market sentiment has shifted from bearish to bullish. In this phase, the asset’s price is declining as sellers dominate, but eventually, the selling pressure subsides, and buyers begin to regain control, pushing the price back up.
This cup shape can vary depending on the time frame being analyzed. It’s common to see Cup and Handle Patterns develop over a wide range of time frames, from short-term intraday charts (which may last minutes or hours) to multi-day, weekly, or even monthly patterns in long-term analysis. Generally, the longer the time frame, the stronger and more significant the pattern tends to be, but it’s important to note that traders can also spot this pattern within shorter time frames, especially during periods of high volatility.
The depth of the cup can vary as well, but ideally, it should be smooth and rounded. A sharp V-shape might signal that the stock’s recovery was too quick and unsustainable, whereas a gradual curve reflects a more natural shift in market sentiment. For most traders, a cup that takes several days or weeks to form is more reliable than one that develops too quickly.
Understanding the Handle
Once the cup forms and the price has returned to its previous high (the rim of the cup), the Handle begins to take shape. The handle is a small pullback or consolidation phase, where the stock retraces slightly from its recent high, typically by 5-15%. This dip may seem like a setback, but it’s a critical part of the pattern because it helps “shake out” weaker traders and consolidate the position before the final breakout.
The handle’s pullback should be relatively shallow compared to the cup. A deep handle or one that retraces too much of the cup’s gain could indicate weakening momentum. Ideally, this handle will form over a short period, lasting a few days in a multi-day pattern or a few minutes in an intraday setup. During the handle formation, the price moves in a slightly downward or sideways direction, often accompanied by a decrease in trading volume as the market waits for the next big move.
This pullback is a sign of hesitation in the market, but it’s important to understand that it typically signals that buyers are regrouping and ready to push the price higher once the handle completes. When viewed in hindsight, this part of the pattern can be seen as the market taking a brief pause before gearing up for the breakout.
The Breakout Moment
The most critical part of the Cup and Handle Pattern is the Breakout, which occurs when the price pushes above the resistance level formed by the rim of the cup. The resistance level is the price point where the cup started to form, and it acts as a key level for traders to watch. Once the price breaks above this level, it typically signals that the stock is ready to continue its upward move.
This breakout is usually accompanied by a surge in trading volume, signaling increased buying interest. Traders often set their buy orders at or just above the breakout point, aiming to catch the stock as it begins its bullish move. The stronger the volume during the breakout, the more confident traders are that the stock will continue to rise.
It’s important to note that not every Cup and Handle Pattern results in a successful breakout. False breakouts can occur when the price momentarily pushes above the resistance level but then fails to sustain the upward momentum. This is why volume plays a crucial role in confirming the breakout; without a strong volume increase, the breakout may lack the buying power necessary to carry the price higher.
Real-Life Examples and Time Frames
The Cup and Handle Pattern can occur across different time frames, making it a versatile tool for traders with varying strategies. For example, day traders might look for this pattern to form on an intraday chart over the course of a few minutes or hours, allowing them to take advantage of short-term price moves. On the other hand, swing traders or long-term investors might spot this pattern on daily or weekly charts, with the formation of the cup and handle taking weeks or even months to complete.
In terms of reliability, the longer the time frame, the more significant the pattern tends to be. A Cup and Handle Pattern that forms over a few months is typically considered more reliable than one that forms in a single trading day. However, even in shorter time frames, this pattern can provide valuable insights, especially when combined with other technical indicators like moving averages or volume analysis.
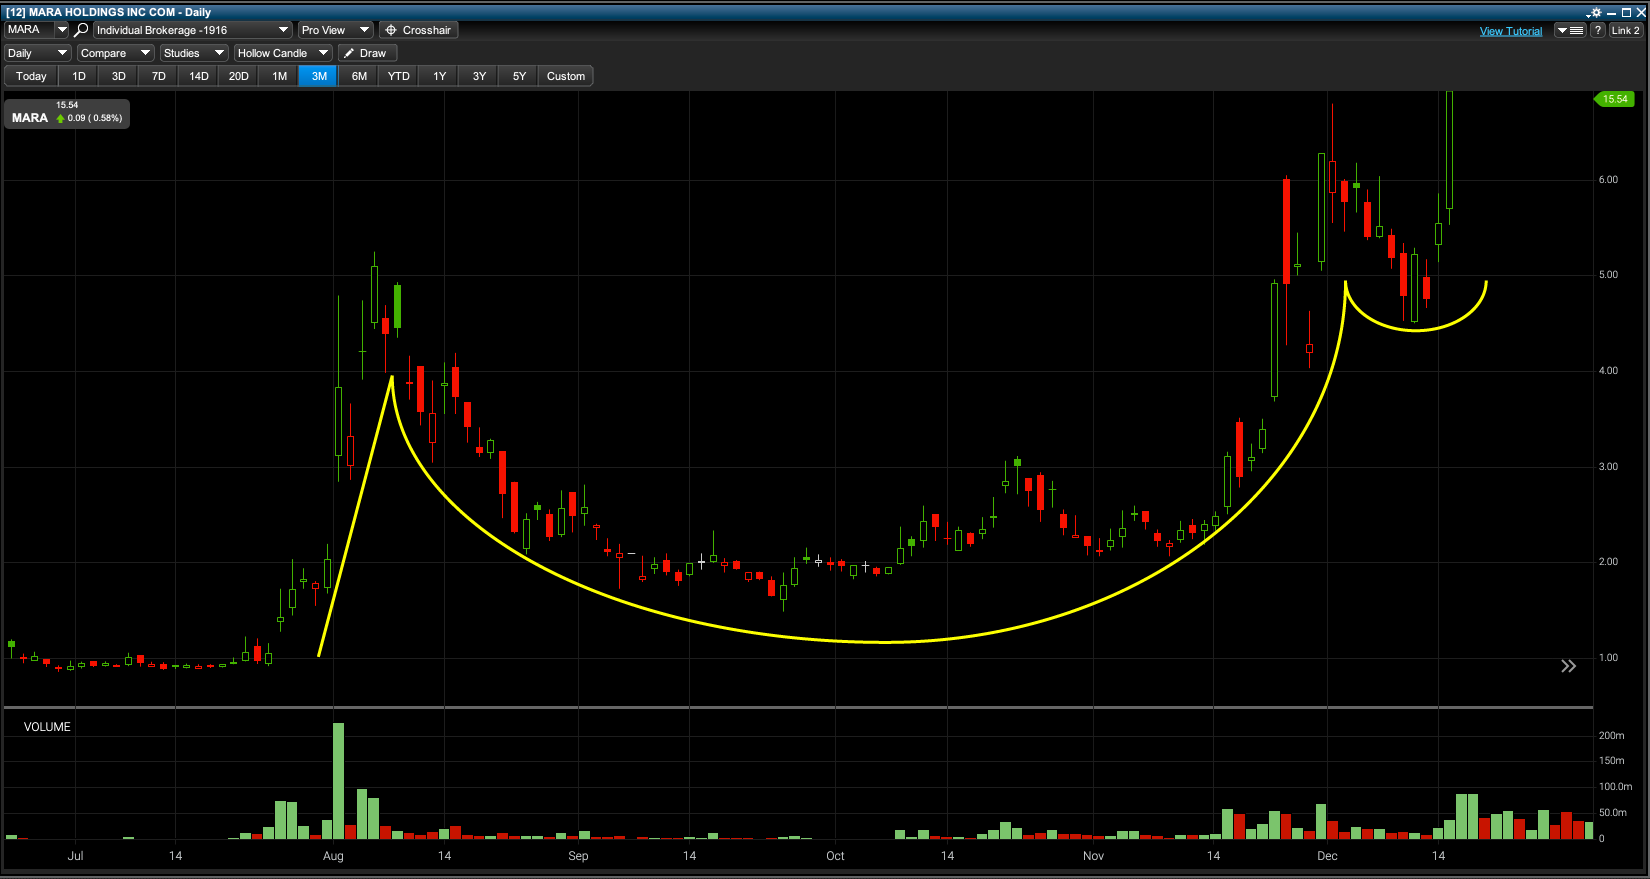
In the chart example above, you can clearly see how the Cup and Handle Pattern unfolds. The price dips into a rounded bottom, rises back to its previous high, forms a brief handle, and then breaks out above the resistance level. This pattern is a textbook example of how buyer sentiment shifts over time, culminating in a bullish breakout.
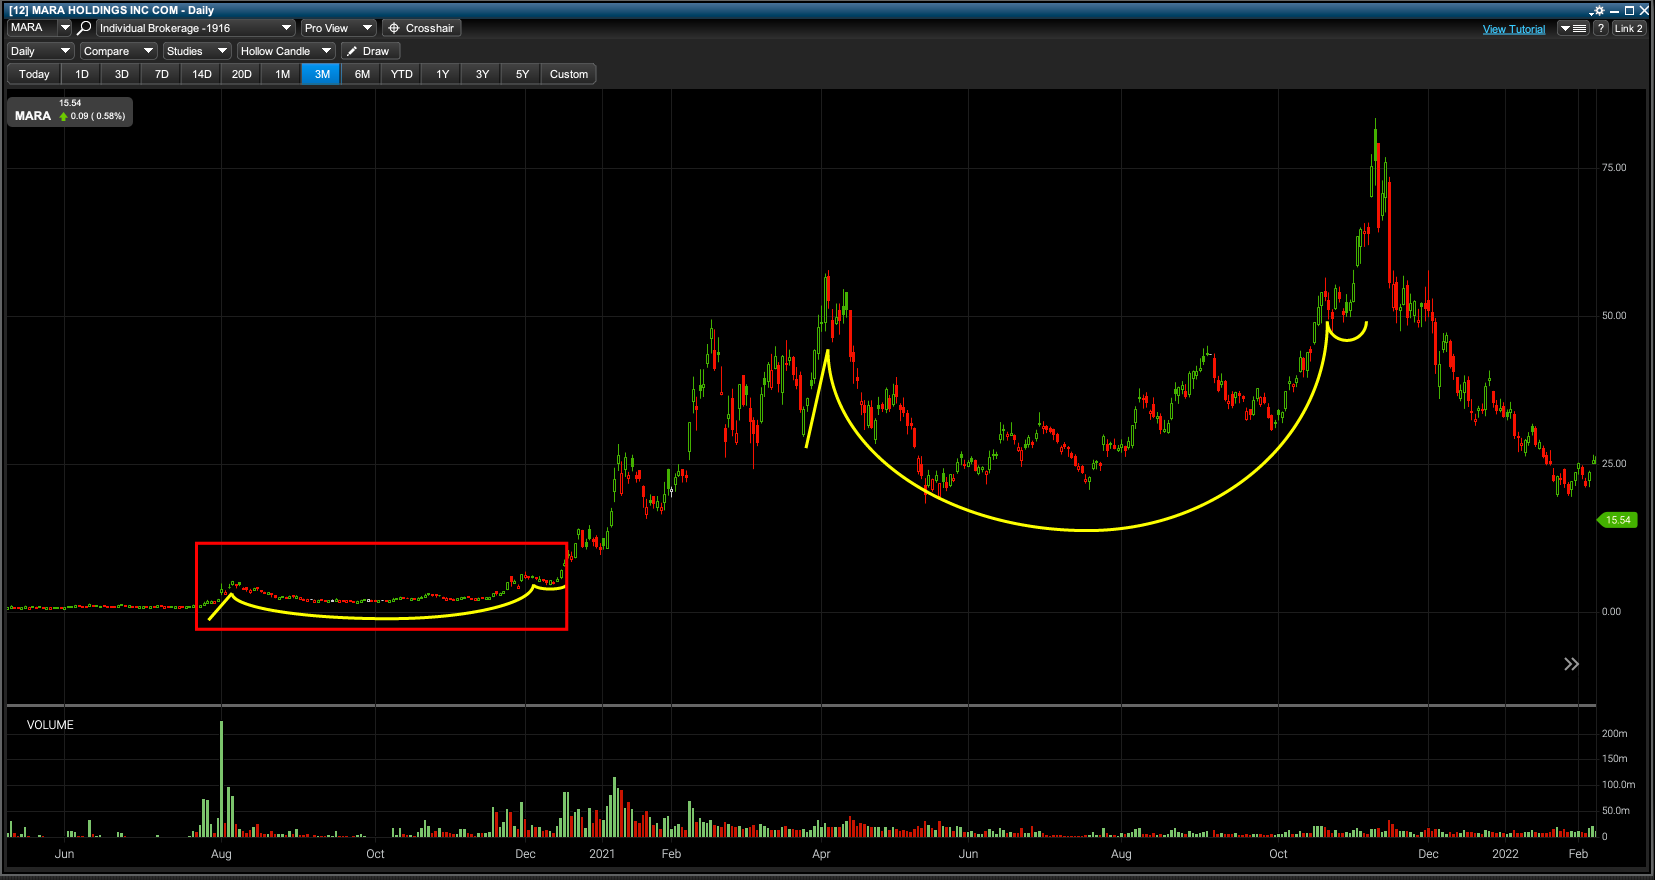
In this second chart, you will see what takes place after the initial breakout of the cup and handle pattern (which is in the red rectangle pictured below). As you progress further right, you will see that yet another cup and handle pattern takes form providing another breakout as well.
Why Traders Rely on the Cup and Handle Pattern
Traders appreciate the Cup and Handle Pattern because of its simplicity and effectiveness in signaling a potential breakout. While no pattern is perfect or guaranteed to succeed, the Cup and Handle Pattern offers a high-probability setup when all the key elements align— a smooth cup, a shallow handle, and a strong breakout confirmed by volume.
Because it works well across different time frames, this pattern is a valuable tool for traders of all styles, whether you’re day trading, swing trading, or looking for longer-term investments. By mastering the recognition and application of this pattern, traders can improve their timing and make more informed decisions about when to enter a trade, potentially increasing their chances of capturing significant gains.
